Download to read offline


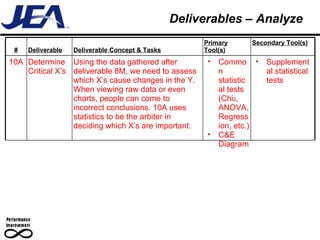
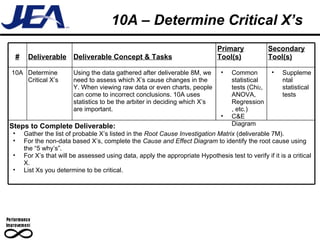
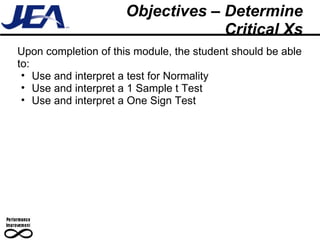
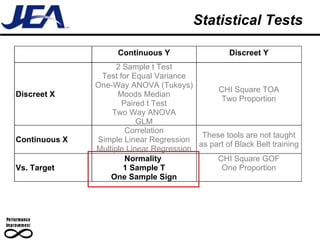
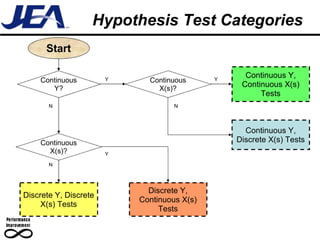
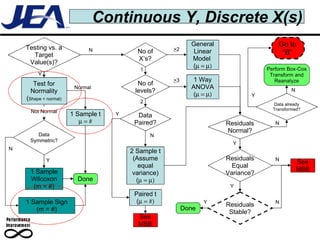
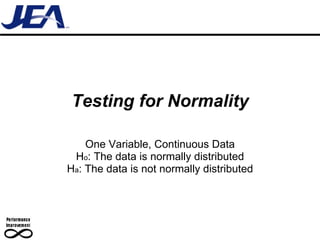
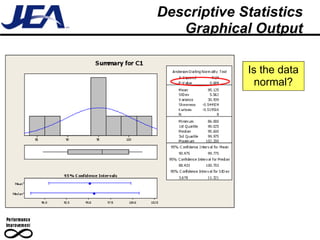
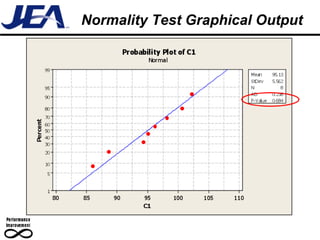

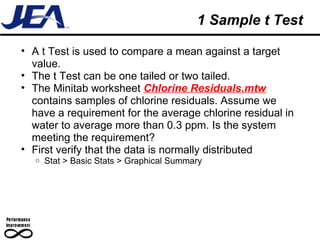
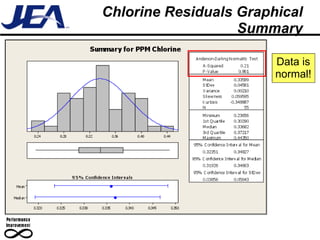
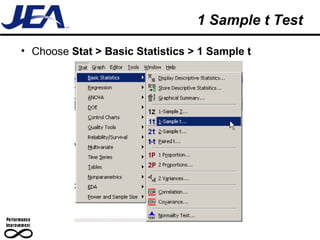
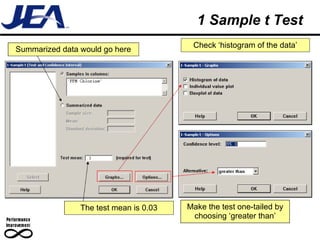

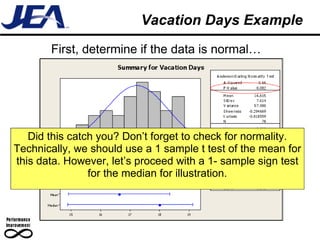


This document provides guidance on using statistical tests to determine which process inputs (X's) are critical and influence outcomes (Y's). It outlines common statistical tests for continuous and discrete data, including tests for normality, one-sample t-tests to compare a mean to a target, and one-sample sign tests to compare a median when data is not normal. Examples are provided to illustrate how to use Minitab to conduct these tests and interpret the results.


![NG BB 53 Process Control [Compatibility Mode]](https://cdn.slidesharecdn.com/ss_thumbnails/6906860-thumbnail.jpg?width=640&height=640&fit=bounds)


